

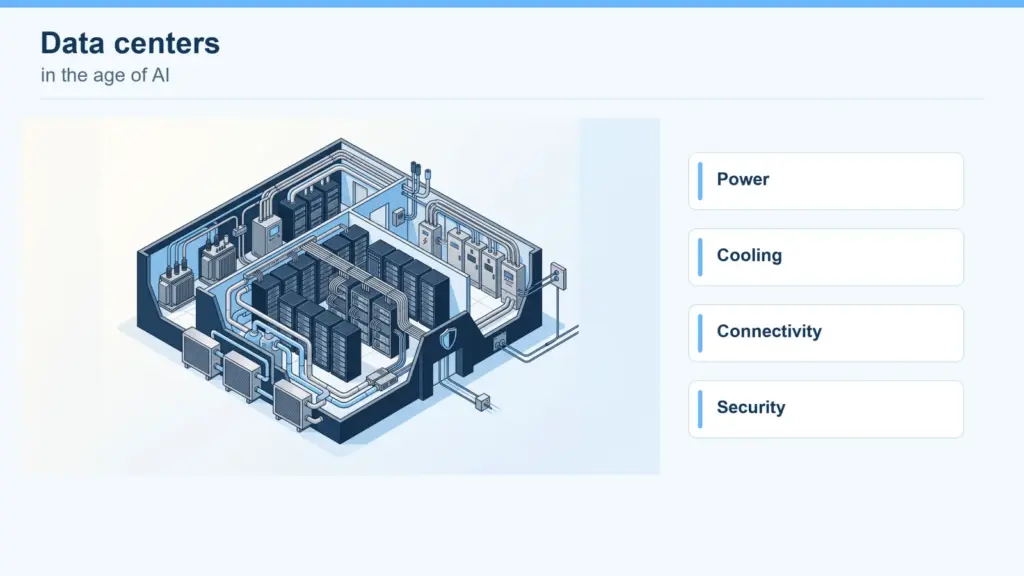
Artificial intelligence is reshaping data centers, increasing demand for computing capacity, faster networks and new approaches to power and cooling.
The strategic question is no longer simply how much infrastructure can grow, but where and with which resources it can grow reliably.
Power sets the pace
The International Energy Agency (IEA) estimates that data centers consumed about 415 TWh of electricity in 2024, or roughly 1.5% of the global total. Its base case projects around 945 TWh by 2030. This is a scenario subject to uncertainty, not a guaranteed forecast.
Electricity availability, connection lead times, transformers and grid infrastructure all influence project viability. Proximity to users remains important, but must be assessed alongside power access and room to expand.
Designing for performance and resilience
- Cooling and efficiency. High-density AI workloads may require liquid cooling and tailored thermal design. Heat reuse can be valuable where technical conditions and local demand support it.
- Storage and connectivity. Software-defined storage, cloud services and high-capacity networks help manage data and connect servers and storage systems.
- Security and continuity. Encryption, physical and network security, and redundant power and connectivity help reduce risk. Geographic distribution can support disaster recovery, but does not guarantee it.
- Location and scalability. Evaluate latency, land, electricity and water availability, costs, permits, suppliers and talent, as well as realistic room for expansion.
- Power flexibility. Batteries and load management can support resilience or grid responsiveness; benefits depend on design, regulation and local conditions.
Market outlook and capacity by country
The following snapshot brings together approximate figures from different dates, scopes and methodologies. Bogotá is a city-level figure; the others should not automatically be treated as equivalent. Announced pipeline is not operational capacity.
| Country | Approximate current capacity | Outlook / pipeline | Notable investments |
|---|---|---|---|
| Chile | 255 MW across 36 operating facilities (Sept. 2026) | 367.8 MW more by 2031; over 120 MW under construction | US$1.616 billion associated with eight developments |
| Colombia | 58 MW in Bogotá (H1 2026) | 300 MW planned in Bogotá; market from US$450 million (2025) to US$1.44 billion (2031) | ODATA: US$1.3 billion for two facilities; first expected by year-end 2026 |
| Peru | 25–50 MW (estimate) | Estimated market growth of 13.6% a year in 2025–2031; Lurín as an AI and hyperscale hub | Gtd: US$13 million more to reach 20 MW in Lurín; special economic zone (ZEEP) regime |
| Spain | 425 MW IT: Madrid 212, Barcelona 63, Aragón 108, rest 42 (Sept. 2026) | Iberian pipeline above 10 GW. Madrid: 538 MW total market capacity and 1,105 MW projected for 2030, using a different methodology | Trade press: over €8 billion under way and up to €90 billion in the pipeline |
| Türkiye | 160 MW (Oct. 2025) | Over 210 MW additional capacity; Ankara reportedly represents about 60% of new capacity | Rönesans–Digital Realty: up to 200 MW and US$3 billion; Trendyol: ~US$500 million (48 MW); Khazna: up to 100 MW |
Other reference markets include Brazil, with more than 1 GW of commissioned capacity, and Mexico, where Querétaro accounts for approximately 300 MW. Latin America has 1.87 GW commissioned and 4.14 GW in the pipeline. Paraguay stands out for electricity prices and Fortaleza, Brazil, for submarine cable connectivity.
For investors and operators, the opportunity is not determined by announced volumes alone: it depends on turning projects into viable facilities with available power, permits, financing and realistic delivery timelines.
Verified sources
Figures use different sources; announced projects may change.